Day 15: I Learned VLOOKUP Twice — First by Building It, Then by Understanding It
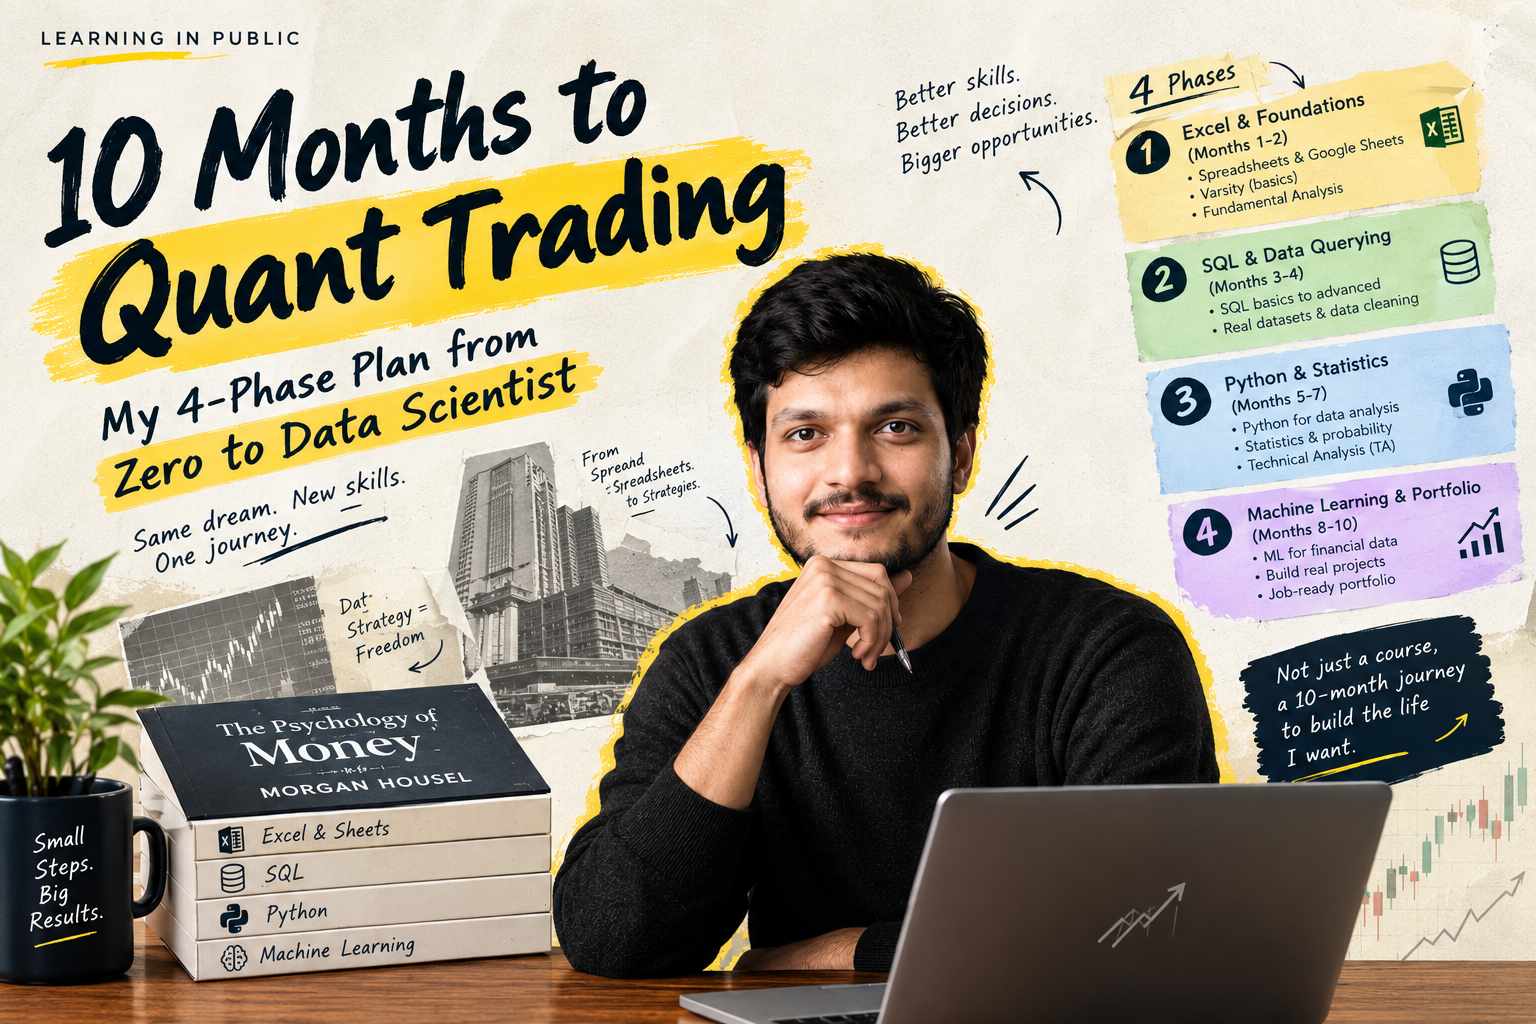
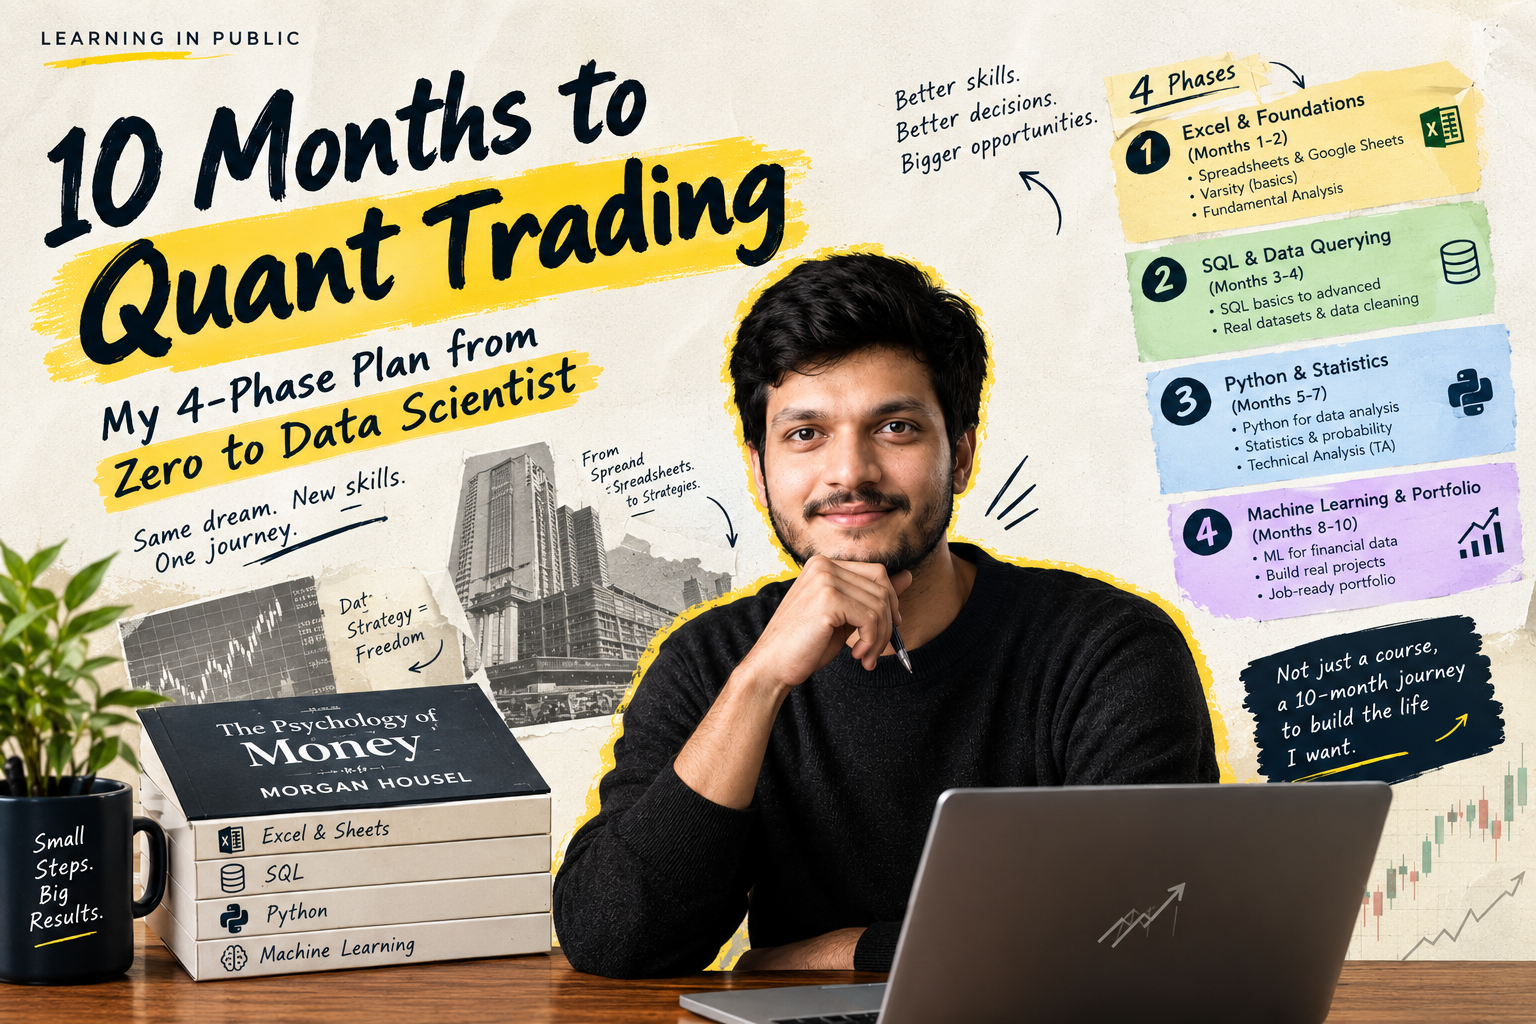
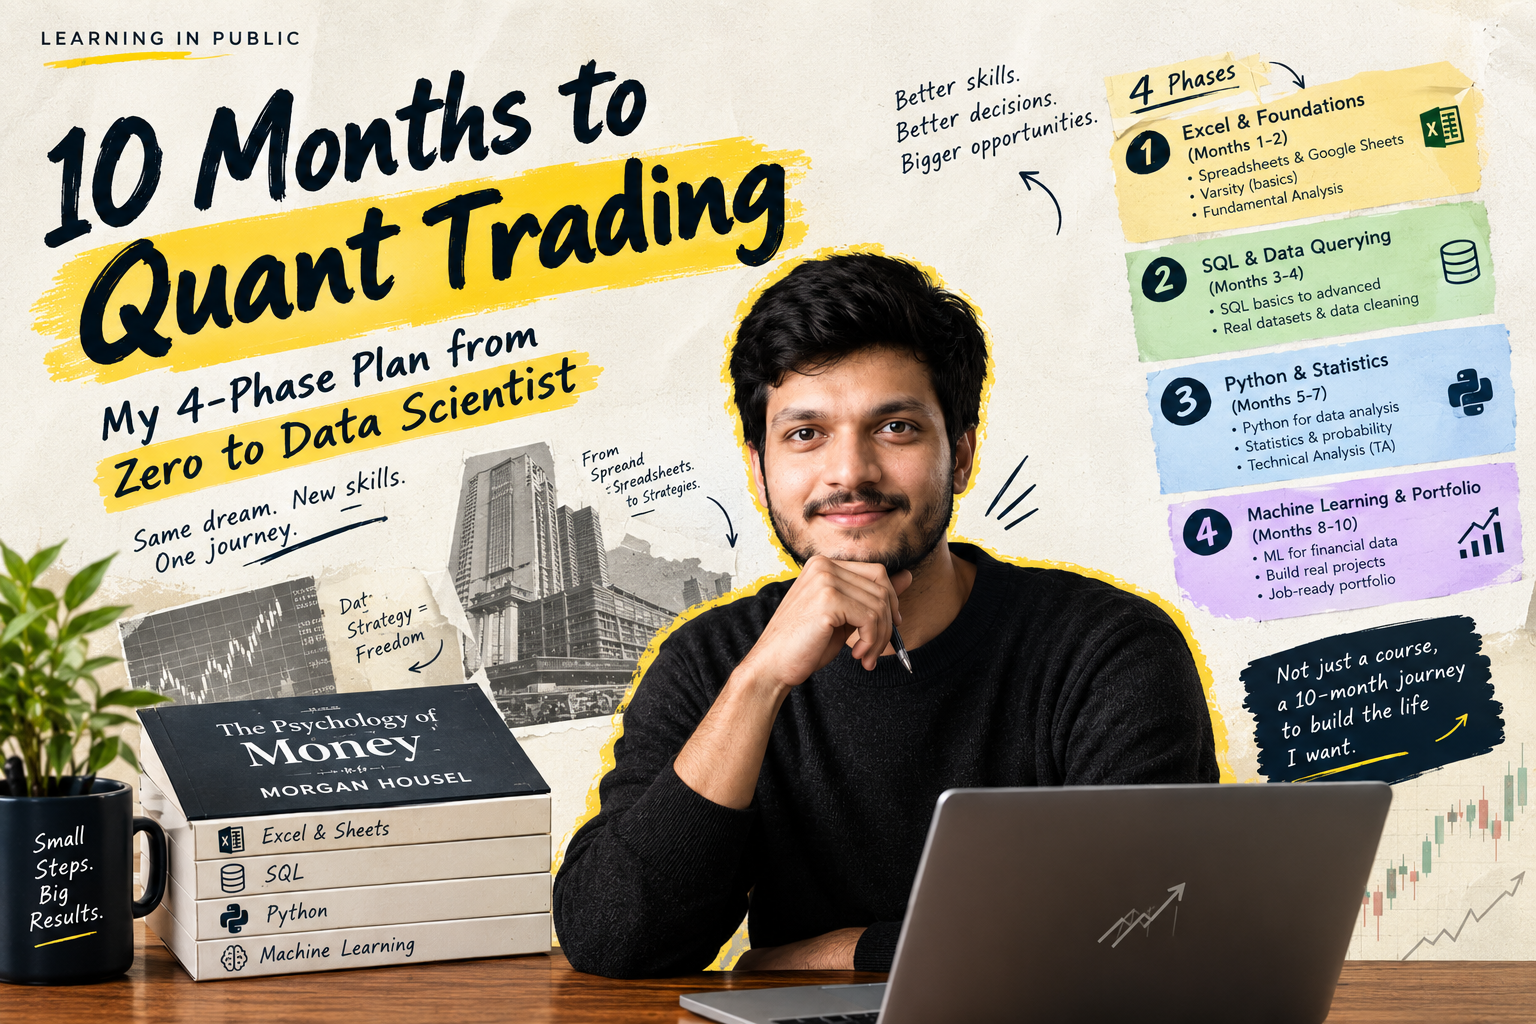
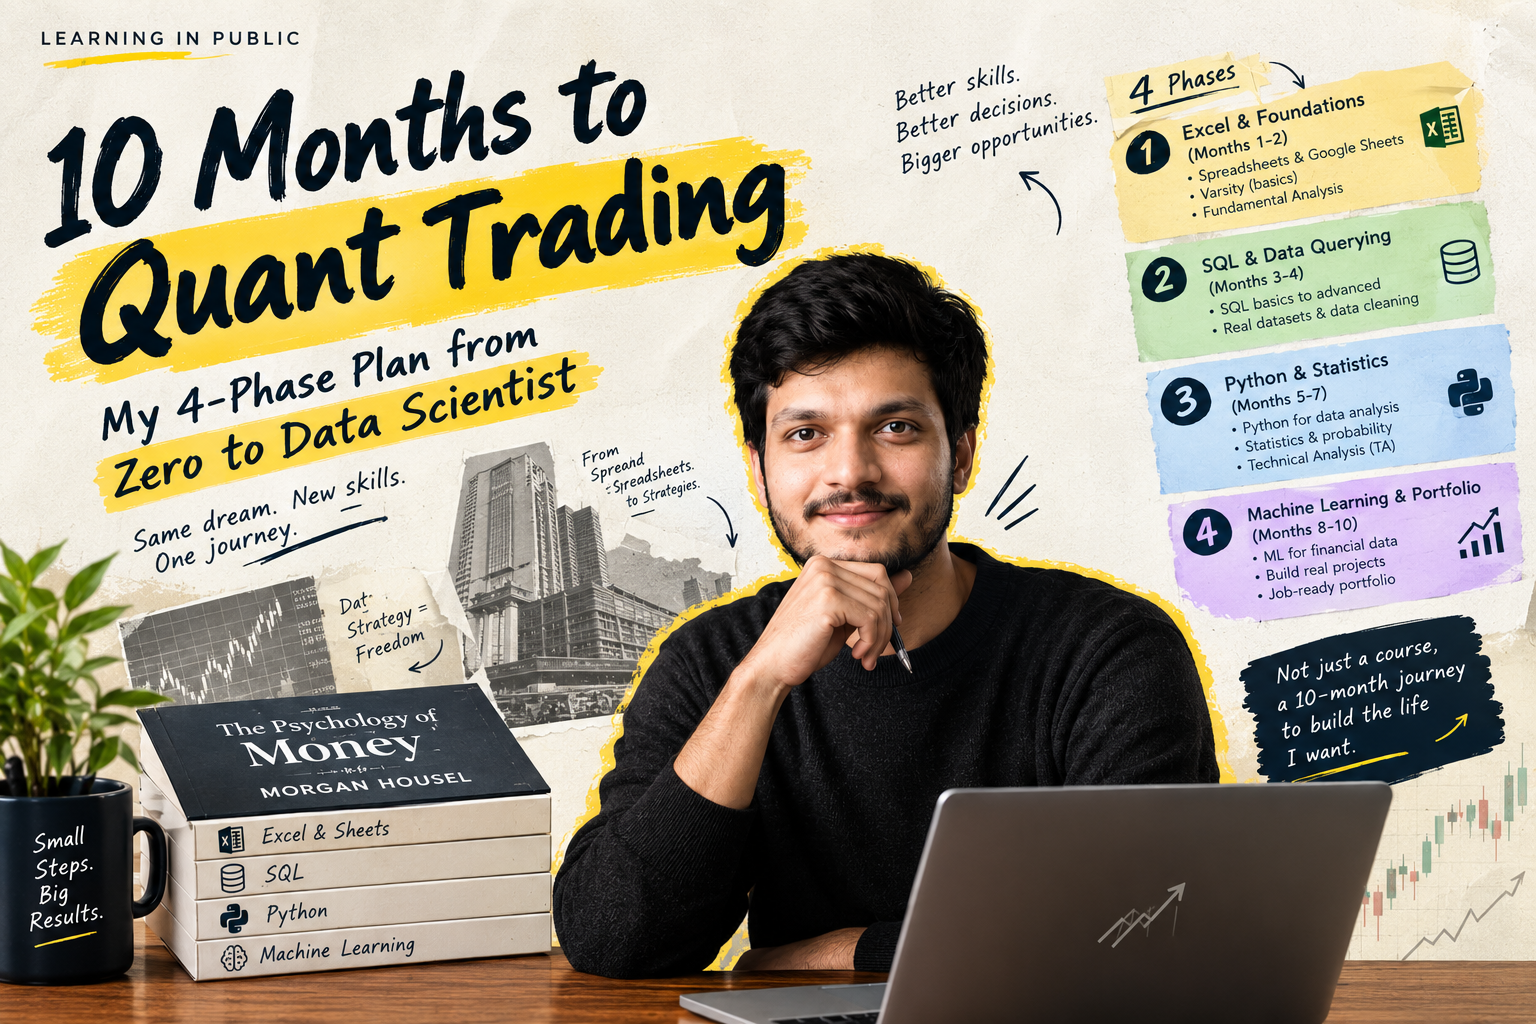
What a Car Inventory project taught me about learning Excel for data science Day 15 of my 10-month journey from zero to Data Science → Quantitative Trading.
When I started learning Excel, I thought the goal was to learn formulas.
IF()
LEFT()
MID()
RIGHT()
VLOOKUP()
But after working through several projects, I'm starting to realize something:
Learning a formula and learning when to use a formula are two different things.
And Day 15 gave me a very good example of that.
🚗 Today's Project: Car Inventory
Today I continued the FreeCodeCamp Excel course and worked through the Car Inventory project.
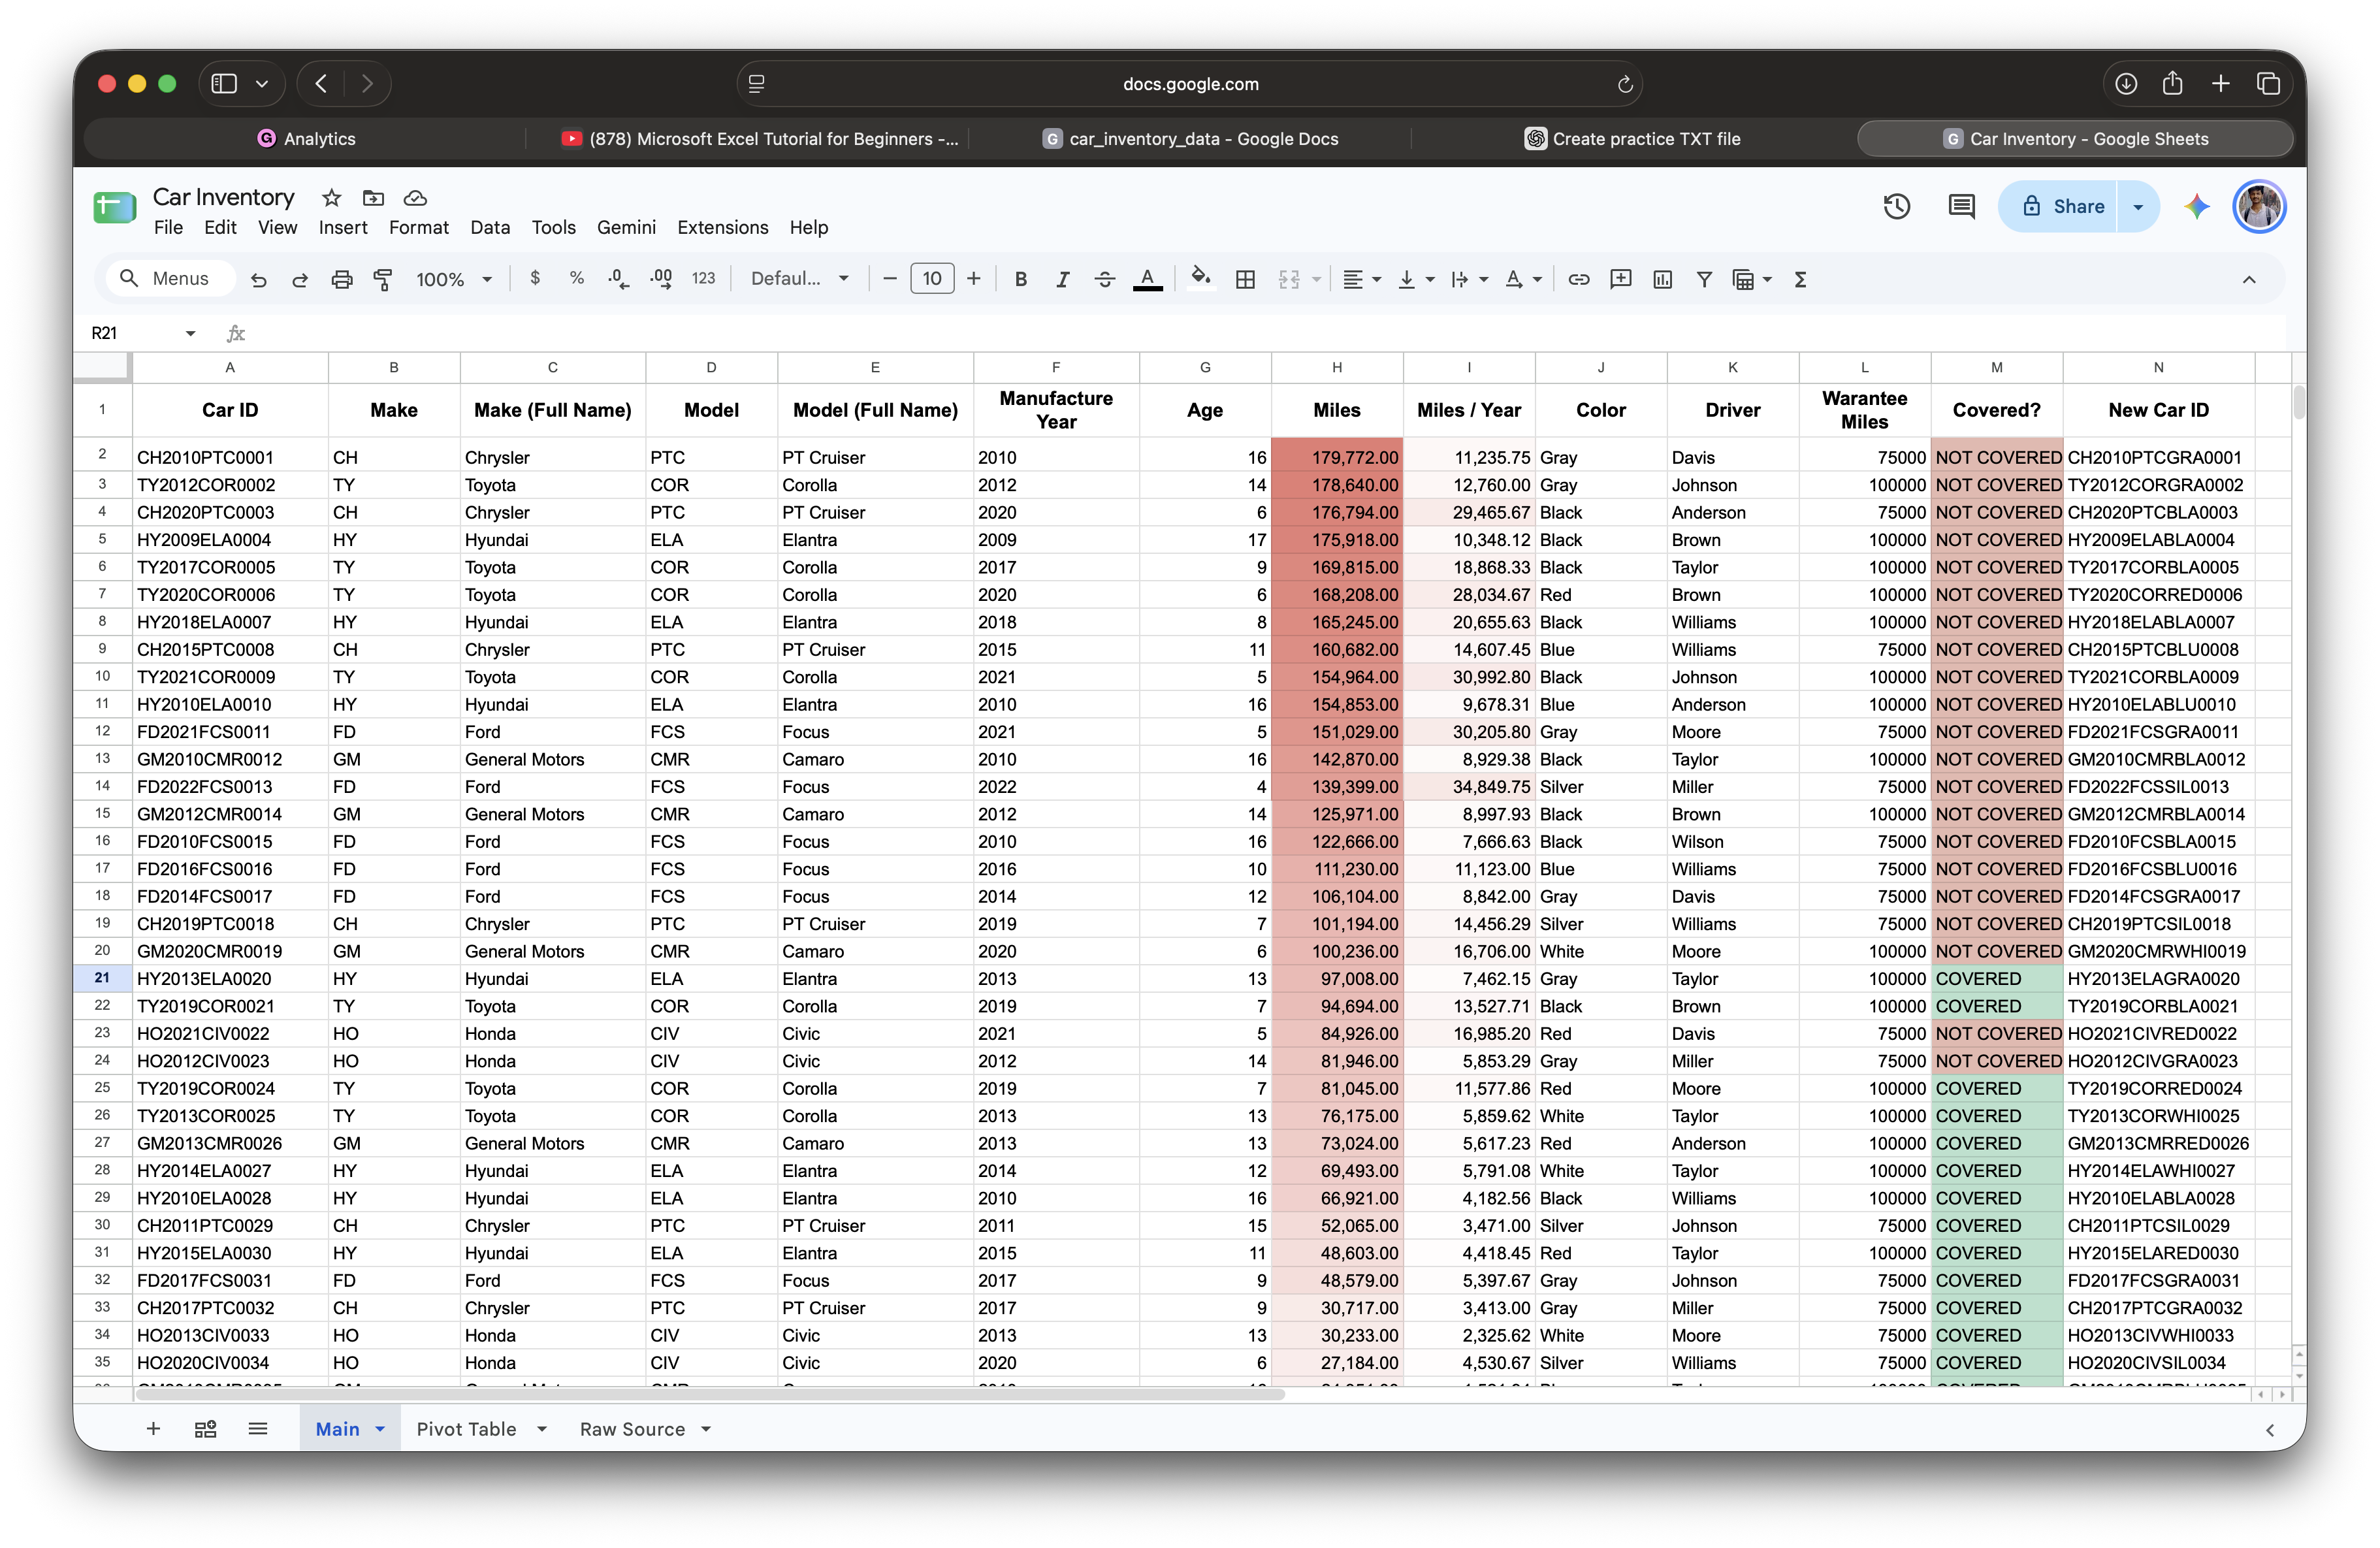
The project looks simple on the surface: a spreadsheet containing information about cars, drivers, mileage, manufacturing years, warranty coverage, and IDs.
But underneath that simple dataset are several important data-analysis skills.
My sheet looked something like this:
| Car ID | Make | Model | Manufacture Year | Age | Miles | Miles / Year | Driver | Covered? |
|---|---|---|---|---|---|---|---|---|
| CH2010PTC0001 | CH | PTC | 2010 | 16 | 179,772 | 11,235.75 | Davis | NOT COVERED |
| TY2012COR0002 | TY | COR | 2012 | 14 | 178,640 | 12,760.00 | Johnson | NOT COVERED |
| CH2020PTC0003 | CH | PTC | 2020 | 6 | 176,794 | 29,465.67 | Anderson | NOT COVERED |
| HY2009ELA0004 | HY | ELA | 2009 | 17 | 175,918 | 10,348.12 | Brown | NOT COVERED |
| TY2017COR0005 | TY | COR | 2017 | 9 | 169,815 | 18,868.33 | Taylor | NOT COVERED |
The interesting thing wasn't the cars.
It was what I could do with the data.
🔎 VLOOKUP: The Part That Hit Differently
Here's where Day 15 connected with something I had already done.
On Day 12, I had already built a VLOOKUP solution myself.
At that point, I wasn't following a textbook workflow.
I had a problem:
“I have a value here, and I need Excel to find the corresponding information somewhere else.”
So I built a solution around that requirement.
Then, on Day 15, FreeCodeCamp officially introduced VLOOKUP as part of the Car Inventory project.
And something interesting happened.
I wasn't seeing VLOOKUP for the first time.
I was seeing the textbook version of something I had already discovered through practice.
🧠 Day 12 vs Day 15
| Day 12 — My Approach | Day 15 — FreeCodeCamp | |
|---|---|---|
| Starting point | A problem I wanted to solve | A structured project |
| Approach | Build the solution myself | Learn the standard method |
| VLOOKUP | Learned through application | Learned as an Excel feature |
| Main lesson | “How can I retrieve this?” | “This is the standard tool for it.” |
| Learning style | Problem → solution | Concept → application |
| Biggest value | Discovery | Formalization |
And this distinction matters.
The formula didn't become more powerful on Day 15.
My understanding became deeper.
📊 From Raw Data to Information
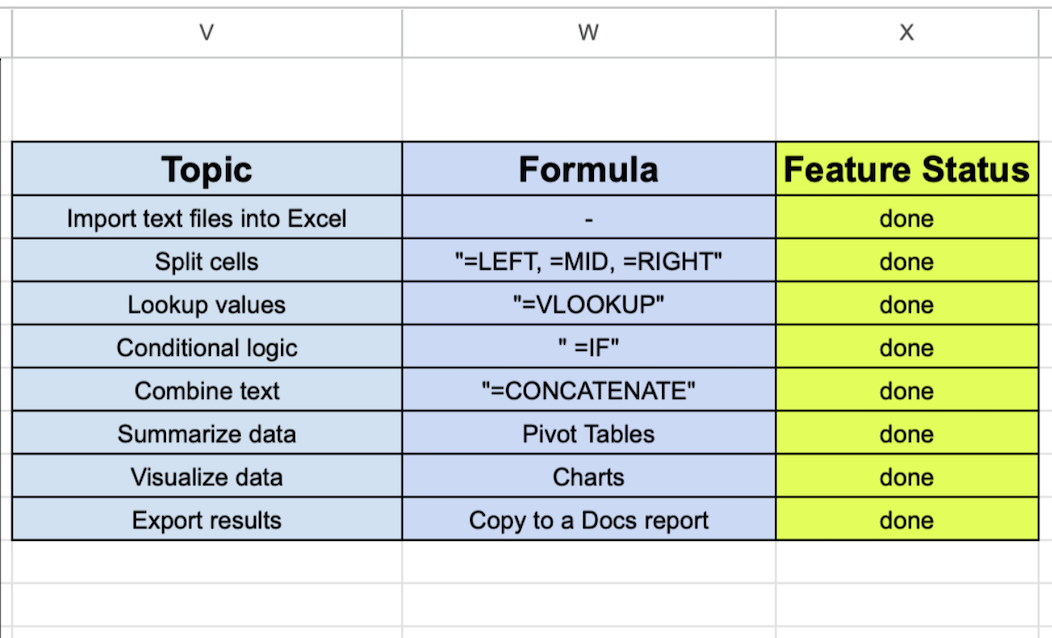
The project also pushed me beyond individual formulas.
I started working with:
importing data
splitting cells
text functions
VLOOKUP
conditional logic
combining text
Pivot Tables
charts
I tracked my progress like this:
| Topic | Formula / Feature | Status |
|---|---|---|
| Import text files | Import | ✅ Done |
| Split cells | LEFT, MID, RIGHT |
✅ Done |
| Lookup values | VLOOKUP |
✅ Done |
| Conditional logic | IF |
✅ Done |
| Combine text | CONCATENATE |
✅ Done |
| Summarize data | Pivot Tables | ✅ Done |
| Visualize data | Charts | ✅ Done |
| Export results | Copy to Docs | ✅ Done |
This table is probably my favorite part of the project.
Because it shows something I didn't understand when I started:
Data analysis isn't one skill. It's a chain of small skills that eventually work together.
📈 I Didn't Want to Stop at the Formula
Once the data was structured, I started asking questions.
For example:
How does mileage vary with vehicle age?
I created a scatter plot of:
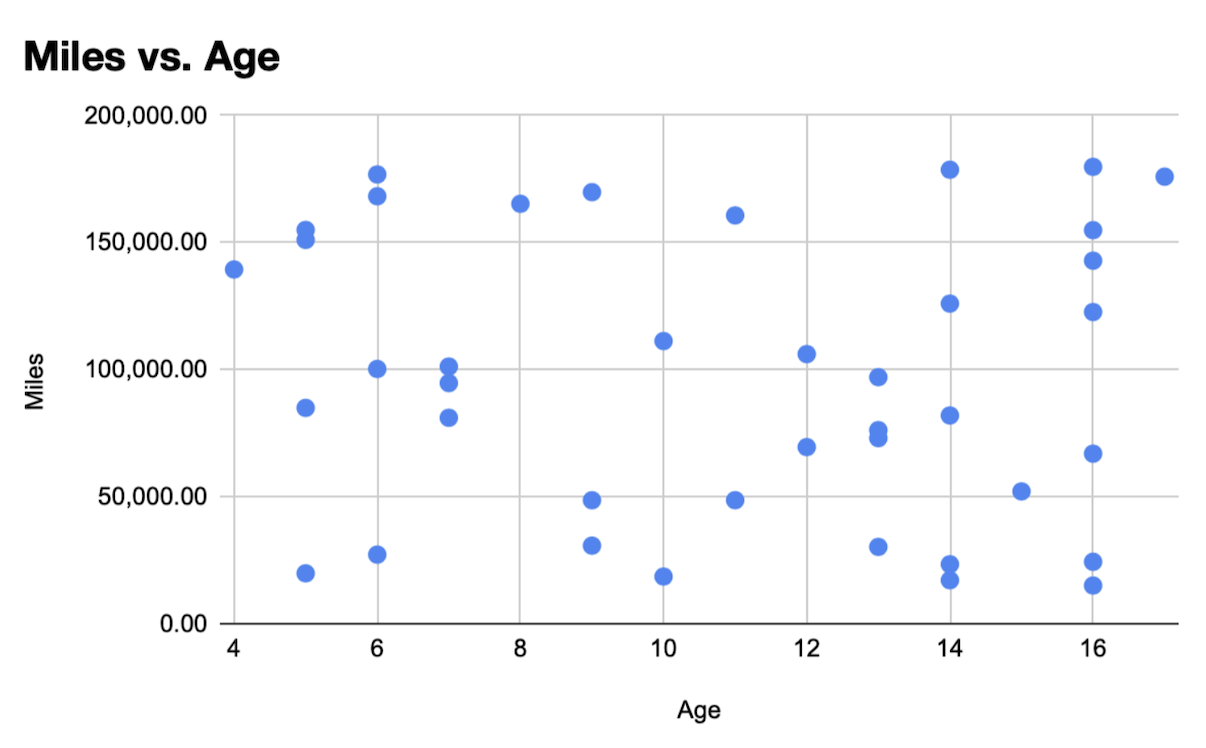
Age → Miles
The result wasn't a “beautiful answer.”
And that's okay.
The important part was learning to move from:
data → formula → analysis → visualization
instead of stopping at:
data → formula.
👥 Then Came the Pivot Table
I also summarized total mileage by driver.
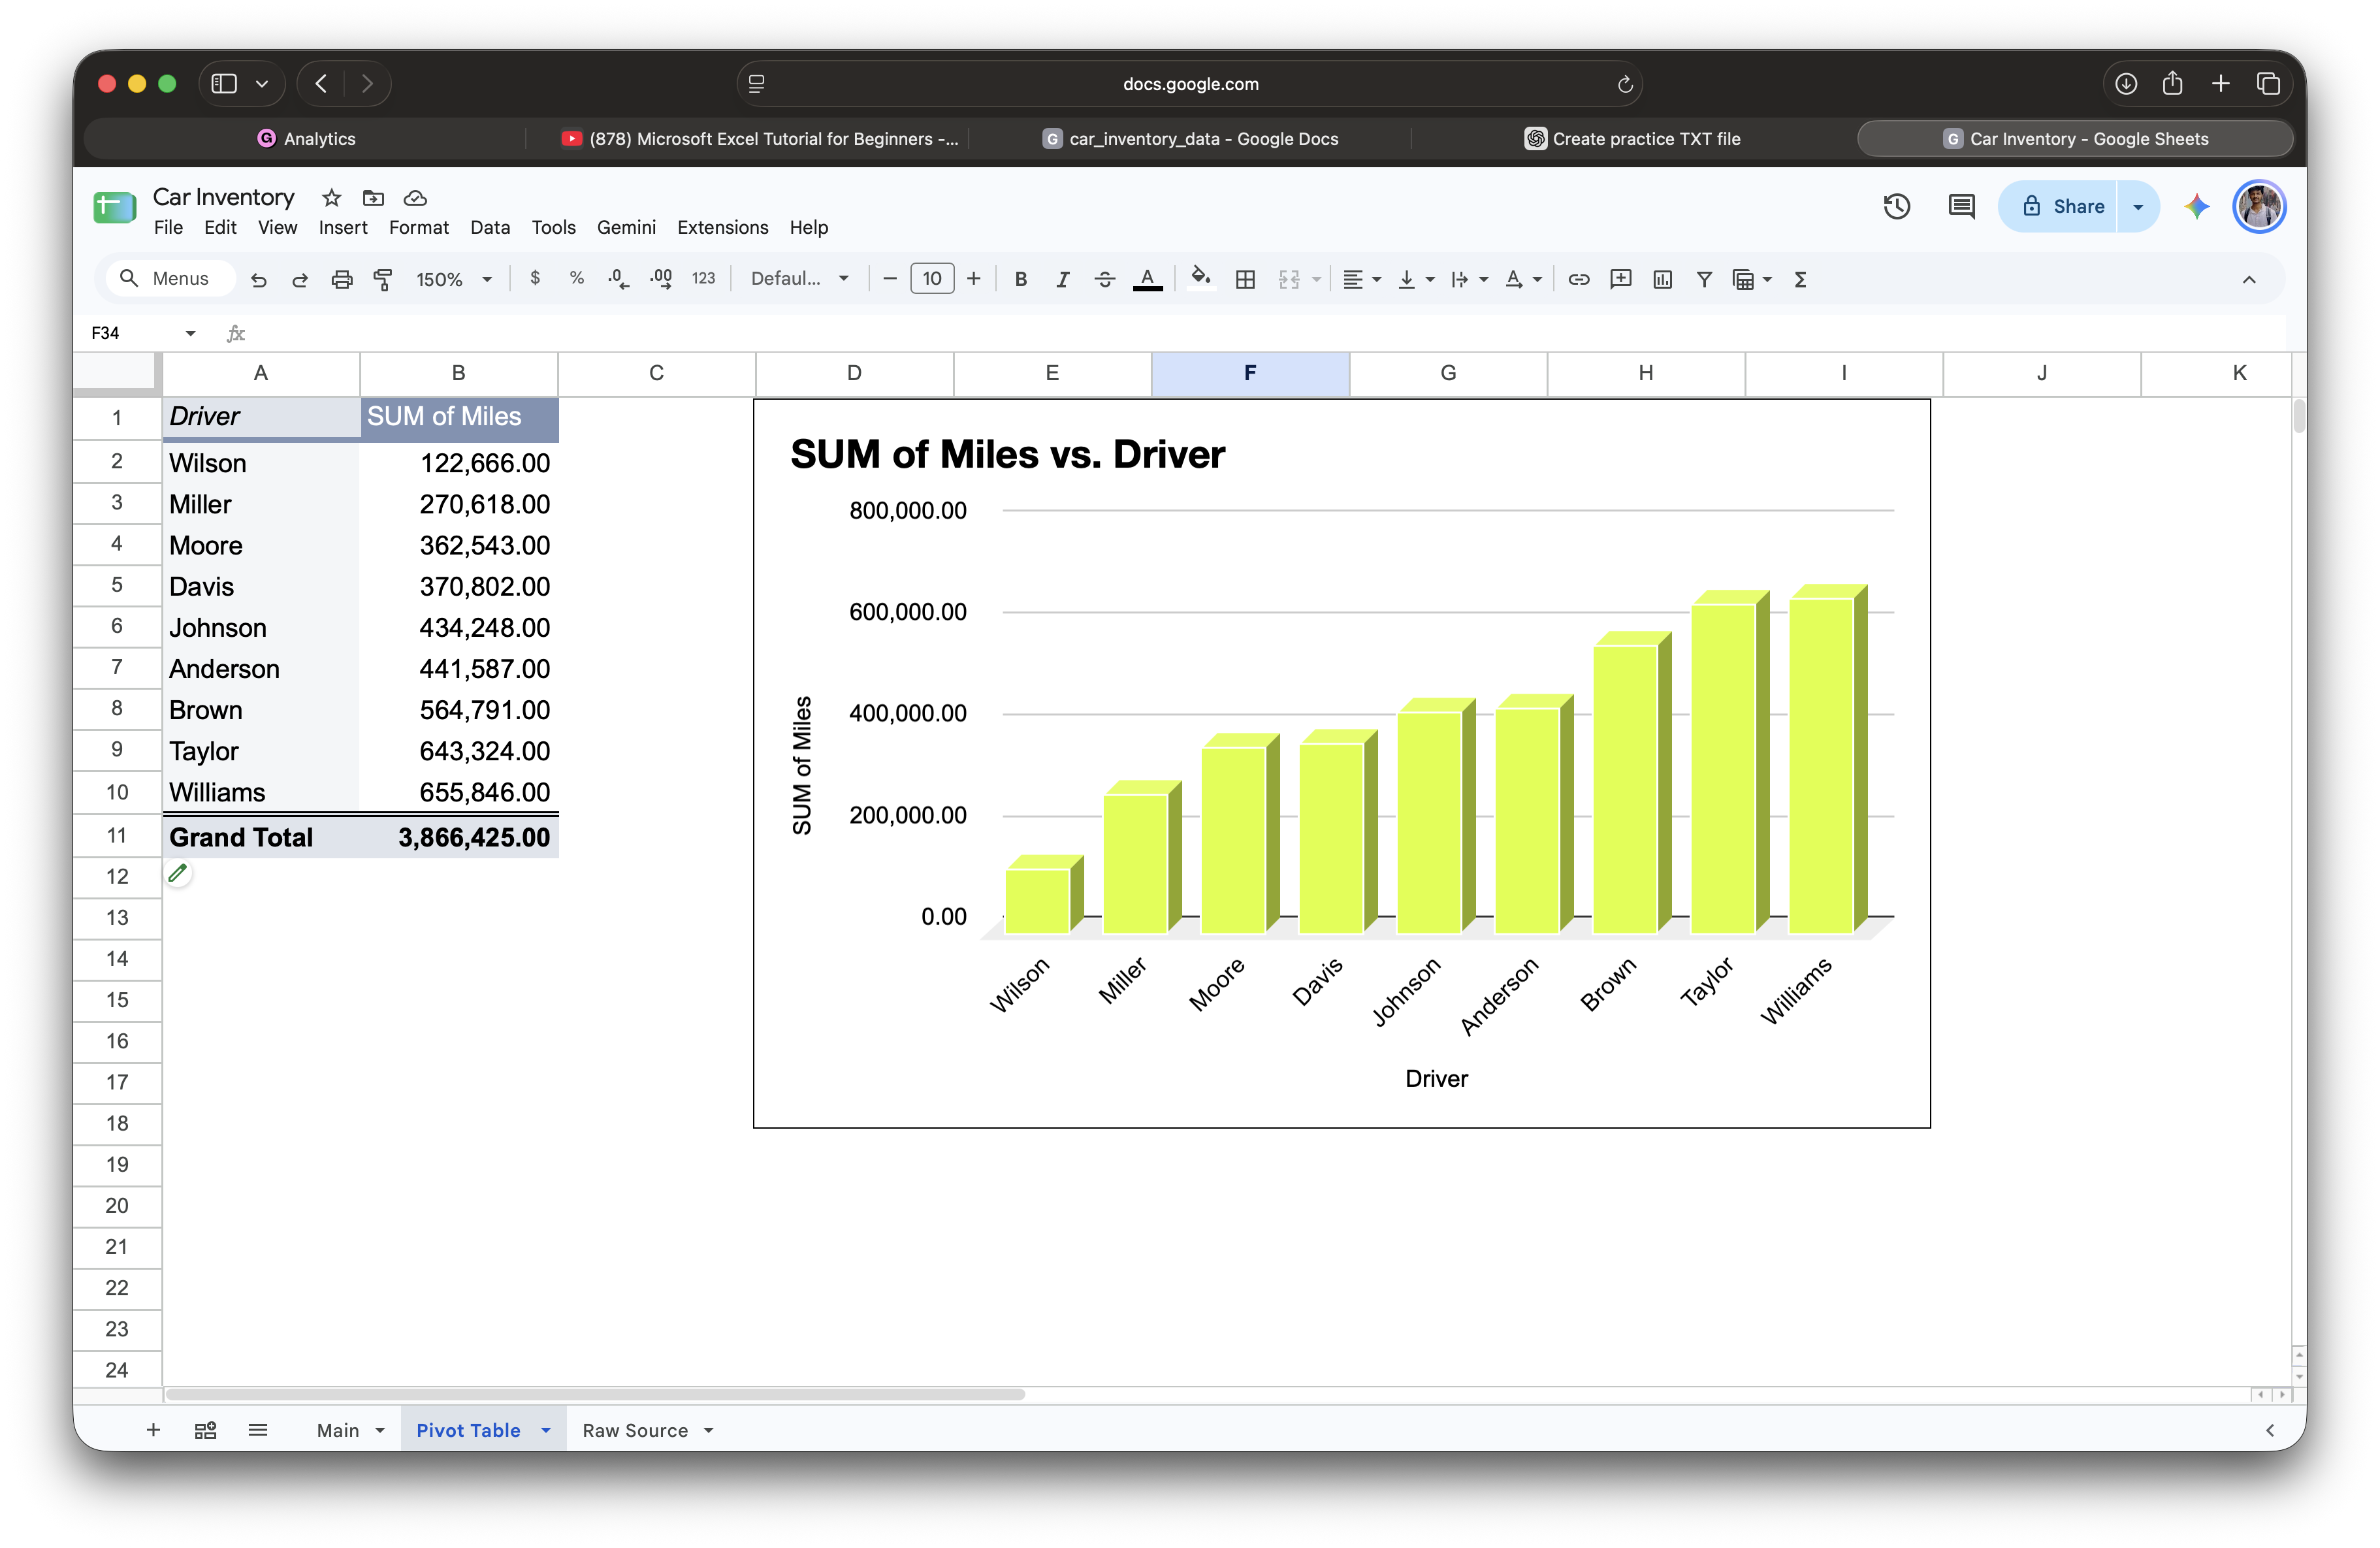
My Pivot Table produced:
| Driver | Sum of Miles |
|---|---|
| Wilson | 122,666 |
| Miller | 270,618 |
| Moore | 362,543 |
| Davis | 370,802 |
| Johnson | 434,248 |
| Anderson | 441,587 |
| Brown | 564,791 |
| Taylor | 643,324 |
| Williams | 655,846 |
| Grand Total | 3,866,425 |
And then I turned the summary into a chart.
That small exercise taught me something important about Pivot Tables:
A Pivot Table isn't just a way to make a table look cleaner. It's a way to ask a question of your dataset.
In this case:
“How much total mileage is associated with each driver?”
🧩 The Bigger Lesson
When I started this journey, I was worried about learning the “right” way.
Should I memorize formulas?
Should I follow tutorials exactly?
Should I build projects?
Should I understand every function before moving forward?
I'm slowly realizing that I need all three:
1. Discover
Try solving a problem yourself.
2. Formalize
Learn how the standard tool or method works.
3. Apply
Use it on another dataset until it becomes natural.
That's exactly what happened with VLOOKUP.
Day 12: I built it.
Day 15: I saw it taught properly.
The second experience was more valuable because the first one existed.
🎯 Why This Matters for My Quant Journey
Right now I'm still very early in my 10-month journey.
I'm working with spreadsheets.
Eventually, I'll move into:
SQL → Python → Statistics → Machine Learning → Financial Data
And eventually, the goal is to work with quantitative trading problems.
Obviously, VLOOKUP isn't going to build a trading strategy.
But that's not the point.
The point is developing the habit of asking:
What is the problem?
What information do I have?
What information do I need?
How can I transform the data to get there?
That way of thinking will matter much more when the spreadsheets become databases, the databases become financial datasets, and the formulas eventually become Python code.
📝 What I Took Away From Day 15
Technical
VLOOKUP
Text manipulation
IF logic
Data importing
Pivot Tables
Charts
Basic data visualization
More importantly
I learned that building something yourself before learning the textbook method changes how you understand the textbook method.
That's probably my biggest takeaway from today.
Day 15 Status
Excel: 🟢
Data cleaning: 🟢
Lookup logic: 🟢
Pivot Tables: 🟢
Visualization: 🟢
Quant journey: Still just getting started.
15 days down. A lot more to learn.
I'm not trying to look like a Data Scientist yet.
I'm trying to become one.